A gauge reading 8% under baseline usually sends the shift straight to a cleaning cycle. The membrane is often innocent. Low UF permeate flow is a hydraulic number, and four stages upstream can pull it down before paint ever reaches the pores. The useful question is not whether the membrane is dirty, but which stage moved the reading first.

Read the Number Before You Blame the Membrane
Water viscosity falls about 2–3% per degree Celsius around normal bath temperature, so UF permeate flow follows temperature almost one to one.
A loop that warmed 4 °C overnight shows more flow with the same membrane. Compare readings at the same temperature, or correct to a fixed reference such as 25 °C.
Check the instrument. A permeate meter drifts after months of service, and a gauge mounted downstream of a throttled valve reads the valve, not the membrane. Confirm the zero point and calibration date. Compare flow at equal transmembrane pressure. If the pressure moved, the flow comparison means nothing.
Log permeate flow beside permeate conductivity and bath solids. The Electrocoat Association treats ultrafiltration as a bath-control loop, not a standalone filter, so a flow number alone hides the cause.
When the Loop Starves the Membrane
Crossflow velocity below design lets rejected paint build a gel layer on the surface.
That layer adds resistance and the flux falls, even though the membrane itself stays clean. The usual culprits sit around the membrane, not inside it. Look at a worn pump impeller, a partly blocked suction strainer, a concentrate valve left half closed, an air pocket after service, or a feed tank running low.
Starvation drops UF permeate flow while transmembrane pressure stays flat or falls with it. Fouling does the opposite, pushing pressure up at the same flow. Read both numbers and the diagnosis narrows fast. Our note on UF system clogging covers the fouling side, so this article stays on the hydraulic side.


Why UF Permeate Flow Falls as Recovery Climbs
Recovery rate sets the concentration factor, and the factor grows faster than most operators expect.
At 80% recovery the feed sees five times its original solids. At 90% it sees ten. Higher solids raise osmotic pressure, which subtracts from the pressure available to push permeate through.
Many lines raise recovery to cut paint loss. Flux drops, someone reads fouling, and the loop goes through a cleaning it did not need. Check the recovery ratio and feed conductivity together before you touch chemistry. A line that lost flow right after a recovery adjustment has its answer already.
Age, Compaction, and the Recovery Test
Membranes compact under pressure, and that loss never comes back.
The element gets thinner, pores tighten, and the baseline steps down year by year. Normal wear, not a fault, yet on a trend chart it looks like slow fouling.
Separate the two with a clean-water test after every cleaning. Record flux at fixed temperature and pressure, then compare with the previous value. If cleaning restores 95% of the last baseline, the membrane is healthy. If recovery slips below roughly 90%, the element is nearing the end of its service life. Our article on when to clean UF membranes covers the cleaning decision, so this piece stops at the diagnosis.


Where Low UF Permeate Flow Usually Starts
Work the loop in order and stop at the first failed number.
– Normalize temperature and confirm the meter zero.
– Verify crossflow through pump curve, strainer pressure drop, and valve position.
– Compare recovery rate and feed solids against the design point.
– Run the clean-water baseline and compare with the last record.
Most low UF permeate flow cases end at step one or two. The membrane rarely leads, and a cleaning started too early shortens element life.
Design Details That Keep the Reading Honest
A few hardware choices decide whether UF permeate flow stays trustworthy.
Put a meter on each skid, not one for the whole loop. Add sample ports before and after the membrane to compare conductivity on the spot. Control permeate temperature, or log it beside every flow reading.
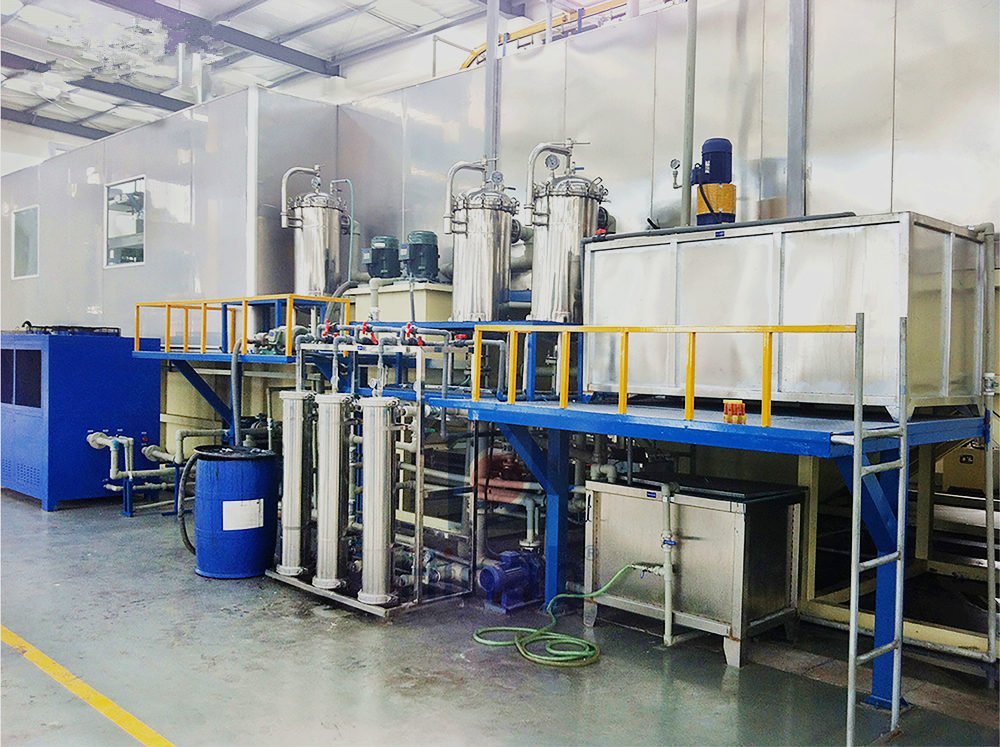
Feed tank turnover matters. A tank that sits too long lets solids settle and the feed stratifies, so each shift loads the membrane differently. US EPA training material on electrocoating names rinse drag-in as a main solids route, and the UF loop sees that same load. Low-point drains help during service. A spare membrane skid looks expensive until a fouled element stops the line for a day. The UF overview covers the wider loop, and the electrophoretic coating line page shows how the skid sits inside the full process.
What to Conclude
Low UF permeate flow is a reading produced by a loop, not a verdict on a membrane.
Check temperature, then crossflow, then recovery, then the baseline, and the cause usually shows up before anyone mixes cleaning chemicals. When the data still points at the membrane, the recovery test tells you whether cleaning helps or the element is simply worn out.